Examples of COHERENS applications
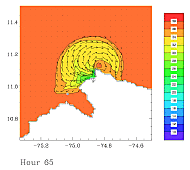
Managing oil spills
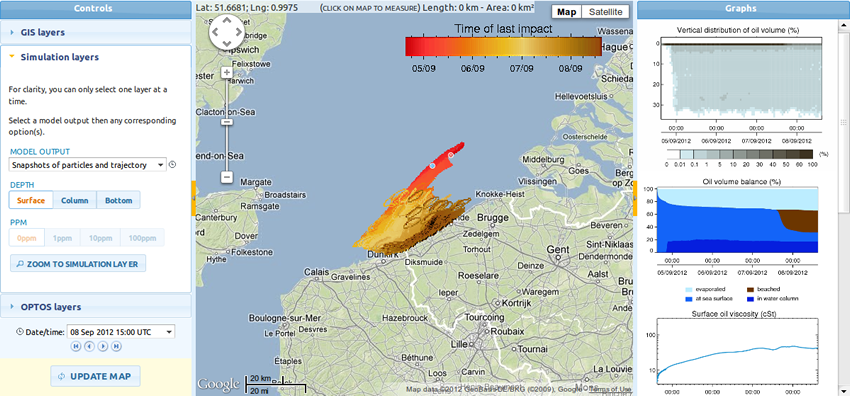
COHERENS has been coupled to an oil spill model (OSERIT; Dulière et al 2012) to generate simulations of the 3D drift and fate of marine oil pollution in the Southern North Sea. This model tool is accessible 24/7 to Coast Guard Centres through a web-interface and provides scientific-based information to support the decision-making process in case of an oil spill. For instance, it can be used to help plan operational interventions, assess the possible environmental and socio-economic impacts, decide whether chemical dispersants should be used or not or even, identify potential polluters.
This project was funded by BELSPO.
References
V.Dulière, F. Ovidio and S. Legrand (2012) Development of an Integrated Software for Forecasting the Impacts of Accidental Oil Pollution- OSERIT. Final Report. Brussels: Belgian Science Policy, 68 pp. (Research Programme Science for a Sustainable Development)
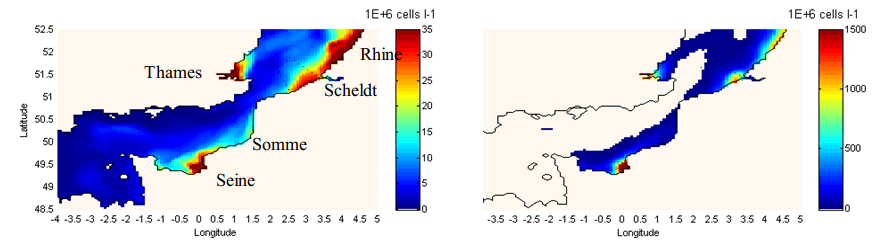
Linking eutrophication problems to human activities
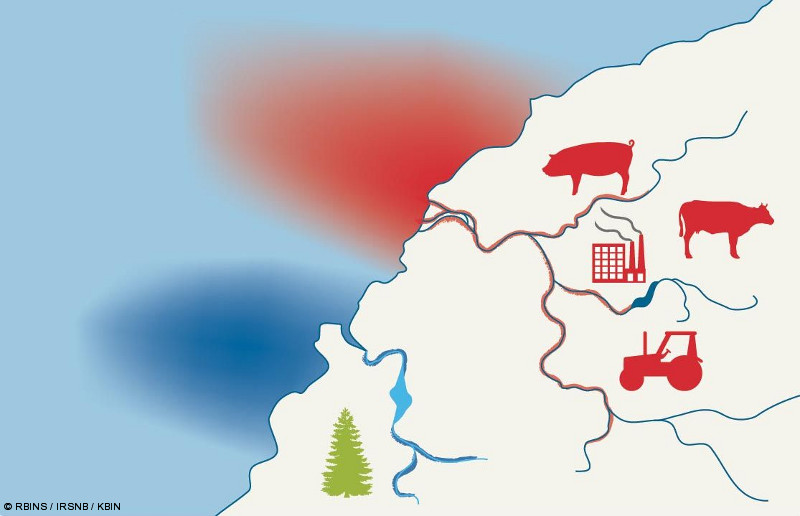
To study the growing anthropogenic pressure in the river watersheds, and subsequent increase in nutrients (nitrogen and phosphorus) loading to the Southern North Sea. COHERENS has been coupled to an ecological model (MIRO; Lancelot et al., 2005) and a generic watershed model based on Riverstrahler/Seneque (Billen et al. 1994). A nutrient tracking approach (Ménesguen et al. 2006) has been adapted and implemented to allow tracking the nutrients in the ocean-river continuum and trace back their sources up to the watersheds. This allows to link eutrophication problems at sea and anthropogenic nutrients inputs but also, for instance, to test nutrient reduction strategies.
This work is being carried out in the framework of the EMoSEM EU project (http://odnature.naturalsciences.be/emosem/) .
References
Billen, G., Garnier, J. and Hanset, P., 1994. Modelling phytoplankton development in whole drainage networks: The RIVERSTRAHLER model applied to the Seine river system. Hydrobiologia, 289: 119-137.
Lancelot C, Spitz Y, Gypens N, Ruddick K, Becquevort S, Rousseau V, Lacroix G, Billen G. 2005. Modelling diatom and Phaeocystis blooms and nutrient cycles in the Southern Bight of the North Sea: the MIRO model. Marine Ecology Progress Series 289:63-78.
Other applications
Magdalena river (Columbia)
Outflow of the Magdalena river at the Carribean coast (Columbia).
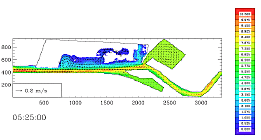
Ijzer river
Drying and wetting in the tidal channel of the Ijzer river (Belgian coast).
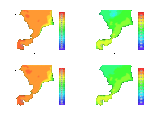
North Sea Project 1989
North Sea Project 1989 bottom and surface temperature and salinity fields.
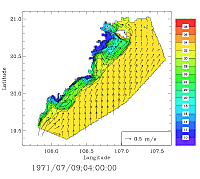
Red River outflow and Halong Bay
Impact of a typhoon on the salinity plume in the Red River outflow zone and Halong Bay (northern Vietnam).